Step 6 — Read your first report
I. Goal
Section titled “I. Goal”You can open Sales overview at end of day and within a minute know how the store is doing, what is selling, and what to watch tomorrow — and you know which of the eleven sidebar Reports answers which question.
II. The complete reports map (read straight from the sidebar)
Section titled “II. The complete reports map (read straight from the sidebar)”The Reports cluster in the sidebar is the single source of truth — every page below resolves to one of these entries (no hidden pages). The list below is taken verbatim from apps/vendor-web/src/components/dashboard/layout/SidebarNavGroups.tsx and apps/vendor-web/src/lib/vendor-dashboard-nav.ts.
| # | Sidebar label | Route | What it answers |
|---|---|---|---|
| 1 | Overview | /dashboard/finance/overview | The 60-second daily recap: revenue, expense, profit rollup. |
| 2 | Sales overview | /dashboard/finance/sales-overview | The headline dashboard for daily revenue (Net, Gross, Tax, Refunds, AOV). |
| 3 | Sales report | /dashboard/finance/sales-report | Detailed breakdown by time bucket, item, employee. |
| 4 | Taxes | /dashboard/finance/taxes | VAT / sales tax collected per rate. |
| 5 | Item sales | /dashboard/finance/item-sales | Revenue and units sold per SKU. |
| 6 | Employee sales | /dashboard/finance/employee-sales | Per-cashier sales, attendance, ranking. |
| 7 | Timesheet report (HR) | /dashboard/finance/timesheet-report | Hours worked, late arrivals, overtime. |
| 8 | Discounts | /dashboard/finance/discounts | Total $ discounted, by coupon / manual / member. |
| 9 | Order types | /dashboard/finance/order-types | Sales split by order type (retail / wholesale / quotation). |
| 10 | Sales by tender & card type | /dashboard/finance/sales-by-tender-and-card-type | Cash vs Card vs Wallet vs Other, per card brand. |
| 11 | Unified finance report | /dashboard/finance/report (default → /dashboard/finance/report/by-time) | One workspace with 15 sub-tabs: by time / by product / by product category / by customer / by staff / by supplier / by registers / by store / retail / wholesale / inventory / receivables / taxes / expenses / low-stock. |
The Unified finance report (
/dashboard/finance/report) is the deepest screen — pick the sub-tab that matches your question. The same report renders across retail and wholesale channels, so you don’t need to flip between two trees.
Related finance screens not in the Reports cluster but you’ll reach them often:
| Surface | Route | Used for |
|---|---|---|
| Finance → Transactions | /dashboard/finance/transactions | Every payment / refund / cash-log entry, with detail drill-down. |
| Finance → Refunds | /dashboard/finance/refunds | Approve / reject pending refunds (see Step 4). |
| Finance → Invoices | /dashboard/finance/invoices | VAT invoices list; create a B2B invoice from a wholesale order. |
| Finance → Receivables | /dashboard/finance/receivables | Customer debt ledger (see Step 5). |
| Finance → Expenses | /dashboard/finance/expenses | Non-revenue spend (rent, utilities, supplier payments). |
| Finance → Closeout | /dashboard/finance/closeout | End-of-day shift-close batches. |
| Finance → Cash log | /dashboard/finance/cash-log | Cash in / cash out events. |
| Finance → Requested reports | /dashboard/finance/requested-reports | Custom / scheduled report jobs. |
| Finance → Sales tax | /dashboard/finance/sales-tax | Sales tax remittance summary. |
| Finance → Removed items | /dashboard/finance/removed-items | Items voided from open orders (Clover “Reports → Removed items”). |
| POS → Report | /point-of-sale/report | End-of-shift totals — the cashier’s view of the day. |
III. Where the reports live
Section titled “III. Where the reports live”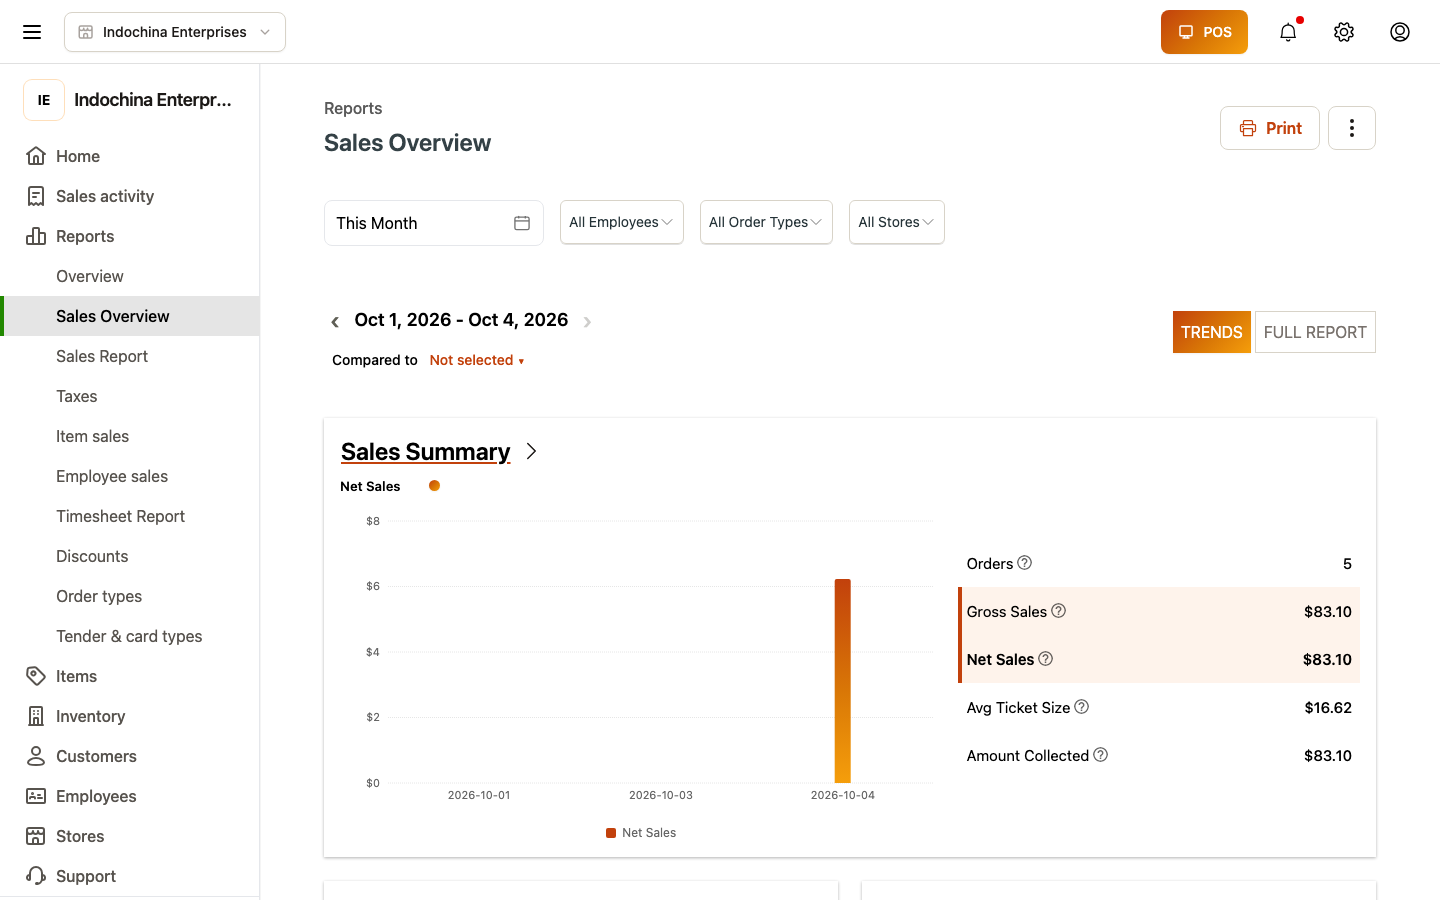 Sales overview — the main page for daily revenue.
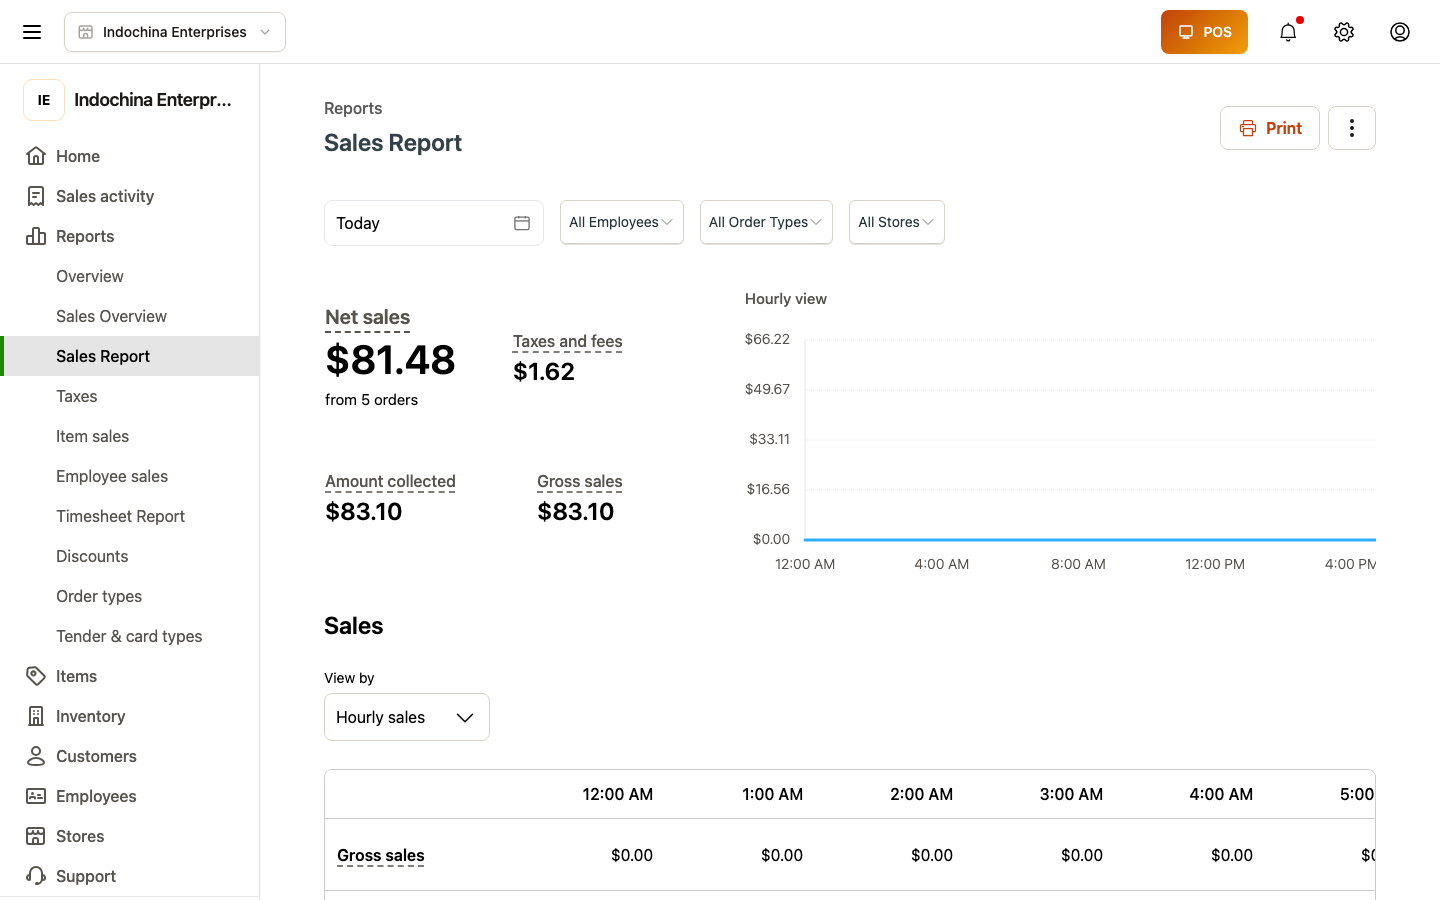 Sales report — detail by time, item, employee.
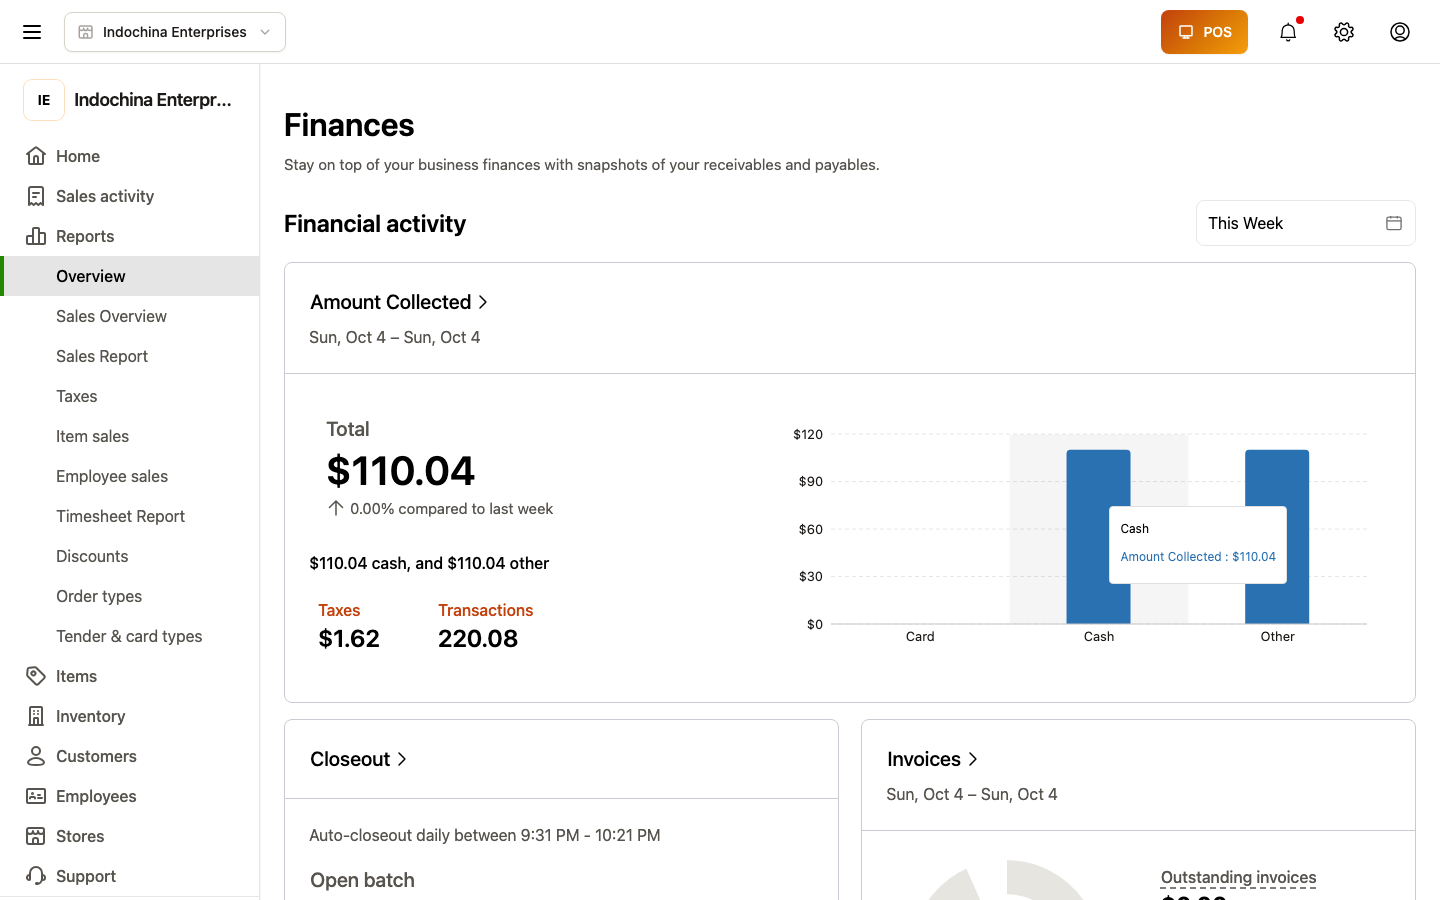 Finance overview — revenue, expense, profit rollup.
IV. Sales overview in 60 seconds
Section titled “IV. Sales overview in 60 seconds”The main page for daily revenue. Pick a date range (in the store’s timezone) and view:
| Tile | What it tells you |
|---|---|
| Net revenue | Revenue after refunds + discounts. The headline number. |
| Gross revenue | Revenue before refunds / discounts. |
| Discounts | Total $ discounted. |
| Refunds | Total $ refunded. |
| Tax | VAT / sales tax collected. |
| Order count | How many orders. |
| Avg. order value | Net revenue ÷ order count. |
Below: period-over-period comparison (last 7 days vs the 7 days before, etc.) and top products + payment-method mix.
Field-by-field reference: Finance → Sales overview → Reports.
V. “Problem-spotter” checklist
Section titled “V. “Problem-spotter” checklist”When scanning a report, look for:
| Symptom | Where to investigate |
|---|---|
| Net revenue dropped vs prior period | Check Refunds — could be one large return. |
| Discounts up, revenue flat | A coupon is in no-minimum-value mode — see Coupons. |
| Payment mix skewed to “Other” | A cashier may be mis-recording the method — check Work shifts. |
| Top products are mostly low-margin | Time to revisit Price lists or Commission sheets. |
| Tax collected is low | Check the store tax rate under Items → Taxes or Settings → General. |
| Wholesale channel revenue much lower than retail | Open Unified finance report → Wholesale tab — the breakdown shows where the gap is (customer concentration, payment terms, returns). |
| Late clock-ins climbing | Reports → Timesheet report — drill into specific employees. |
| High refund count from one cashier | Reports → Employee sales → drill into that employee → see their refund activity. |
VI. Export & share
Section titled “VI. Export & share”- Click the download icon on any chart → export CSV.
- Click the date-range label → pick a custom period.
- For an end-of-day snapshot, the POS shift report auto-generates when the shift closes — see Work shifts.
VII. FAQ
Section titled “VII. FAQ”My report is in the wrong timezone. Each store has its own IANA timezone in Settings → General. The dashboard uses the selected store’s timezone, not the browser’s. See the store-timezone rule.
Why does “Today” show yesterday’s data? You picked a store with a timezone behind yours. Switch stores or change the timezone.
Report numbers don’t match the shift totals. That’s expected — finance reports are per store and include all lanes; shift totals are per lane. Use Sales overview for the whole day, POS shift report for a single drawer.
Where do I find the wholesale-vs-retail split? Open Unified finance report (/dashboard/finance/report) → the Retail and Wholesale sub-tabs.
VIII. End of onboarding — where next?
Section titled “VIII. End of onboarding — where next?”You’ve finished the six core steps to run the store:
- ✅ Add products
- ✅ Stock in (Lots)
- ✅ Take a sale
- ✅ Process returns
- ✅ Manage customer debt
- ✅ Read the day’s reports
Next, branch into the area you need most:
- Multiple lanes? → Work shifts
- Multiple cashiers? → Roles
- Wholesale / on-credit sales? → Wholesale orders
- Launching loyalty? → Membership plans